
Page 188 - Proceedings of the State Natural History Museum. Issue 37 (Lviv, 2021)
P. 188
Сharacteristics of visible autumn migrations of the common crane … 187
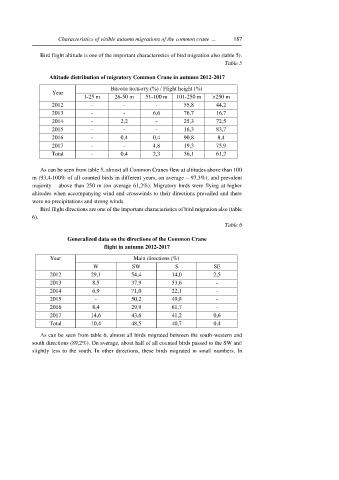
Bird flight altitude is one of the important characteristics of bird migration also (table 5).
Table 5
Altitude distribution of migratory Common Crane in autumn 2012-2017
Висота польоту (%) / Flight height (%)
Year
1-25 m 26-50 m 51-100 m 101-250 m >250 m
2012 - - - 55,8 44,2
2013 - - 6,6 76,7 16,7
2014 - 2,2 - 25,3 72,5
2015 - - - 16,3 83,7
2016 - 0,4 0,4 90,8 8,4
2017 - - 4,8 19,3 75,9
Total - 0,4 2,3 36,1 61,2
As can be seen from table 5, almost all Common Cranes flew at altitudes above than 100
m (93,4-100% of all counted birds in different years, on average – 97,3%), and prevalent
majority – above than 250 m (on average 61,2%). Migratory birds were flying at higher
altitudes when accompanying wind and crosswinds to their directions prevailed and there
were no precipitations and strong winds.
Bird flight directions are one of the important characteristics of bird migration also (table
6).
Table 6
Generalized data on the directions of the Common Crane
flight in autumn 2012-2017
Year Main directions (%)
W SW S SE
2012 29,1 54,4 14,0 2,5
2013 8,5 37,9 53,6 -
2014 6,9 71,0 22,1 -
2015 - 50,2 49,8 -
2016 8,4 29,9 61,7 -
2017 14,6 43,6 41,2 0,6
Total 10,4 48,5 40,7 0,4
As can be seen from table 6, almost all birds migrated between the south-western and
south directions (89,2%). On average, about half of all counted birds passed to the SW and
slightly less to the south. In other directions, these birds migrated in small numbers. In