Page 184 - Proceedings of the State Natural History Museum. Issue 37 (Lviv, 2021)
P. 184

Сharacteristics of visible autumn migrations of the common crane …   183
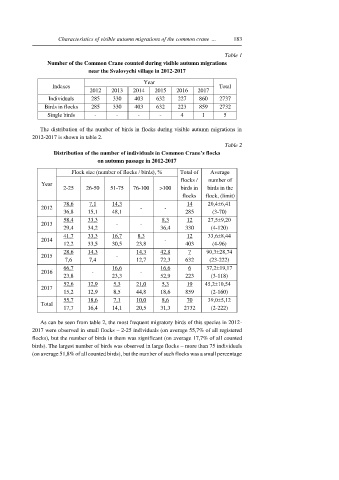
                                                                                Table 1
                  Number of the Common Crane counted during visible autumn migrations
                                near the Svalovychi village in 2012-2017

                                                    Year
                   Indexes                                                    Total
                                 2012   2013    2014   2015    2016   2017
                  Individuals    285     330    403     632     227    860    2737
                 Birds in flocks   285   330    403     632     223    859    2732
                  Single birds    -       -      -       -      4       1       5

               The distribution of the number of birds in flocks during visible autumn migrations in
            2012-2017 is shown in table 2.
                                                                                Table 2
                    Distribution of the number of іndіvіduals in Common Crane’s flocks
                                   on autumn passage in 2012-2017

                          Flock sіze (number of flocks / birds), %   Total of   Average
                                                                 flocks /   number of
                Year
                       2-25    26-50    51-75   76-100   >100   birds in   birds in the
                                                                 flocks   flock, (limit)
                       78,6     7,1     14,3                       14     20,4±6,41
               2012                               -        -
                       36,8     15,1    48,1                      285       (3-70)
                       58,4     33,3                      8,3      12     27,5±9,20
               2013                       -       -
                       29,4     34,2                     36,4     330      (4-120)
                       41,7     33,3    16,7     8,3               12     33,6±8,44
               2014                                        -
                       12,2     33,5    30,5     23,8             403       (4-96)
                       28,6     14,3             14,3    42,8      7      90,3±28,74
               2015                       -
                        7,6     7,4              12,7    72,3     632      (23-222)
                       66,7             16,6             16,6      6      37,2±19,17
               2016              -                -
                       23,8             23,3             52,9     223      (3-118)
                       52,6     12,9     5,3     21,0     5,3      19    45,2±10,54
               2017
                       15,2     12,9     8,5     44,8    18,6     859      (2-160)
                       55,7     18,6     7,1     10,0     8,6      70     39,0±5,12
               Total
                       17,7     16,4    14,1     20,5    31,3     2732     (2-222)

               As can be seen from table 2, the most frequent migratory birds of this species in 2012-
            2017 were observed in small flocks – 2-25 individuals (on average 55,7% of all registered
            flocks), but the number of birds in them was significant (on average 17,7% of all counted
            birds). The largest number of birds was observed in large flocks – more than 75 individuals
            (on average 51,8% of all counted birds), but the number of such flocks was a small percentage
   179   180   181   182   183   184   185   186   187   188   189