
Page 78 - NZDPM 33/2017
P. 78
Detection of forest loss on Black Stork (Ciconia nigra L.) breeding sites … 77
The results in the first approach were cumulative, because the area of forest loss for
each of subsequent buffers (e.g. 0-500 m buffer) contained results from the all smaller
buffers. Another approach was to calculate the amount of pixels in bands (rings) at the
following distances: 0-100 m, 100-200 m, 200-300 m, 300-400 m, 400-500 m. The results
in the second case are not cumulative and the scale of forest loss is assessed for each of the
bands separately.
Apart from the analysis in buffers we created a map of forest loss in the region by
aggregating pixels from the GFW data into 10×10 km squares using the "Zonal statistics as
table" tool in ArcGIS 10.5. The map was used to analyze the distribution of nests in relation
to the intensity of logging in the region.
Results and discussions
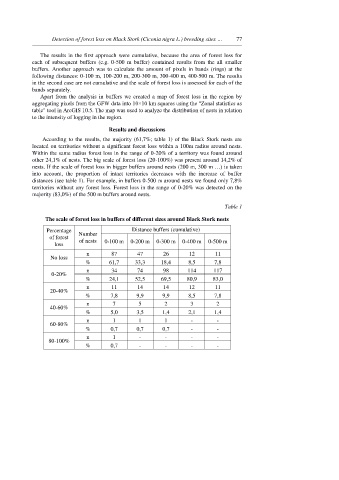
According to the results, the majority (61,7%; table 1) of the Black Stork nests are
located on territories without a significant forest loss within a 100m radius around nests.
Within the same radius forest loss in the range of 0-20% of a territory was found around
other 24,1% of nests. The big scale of forest loss (20-100%) was present around 14,2% of
nests. If the scale of forest loss in bigger buffers around nests (200 m, 300 m …) is taken
into account, the proportion of intact territories decreases with the increase of buffer
distances (see table 1). For example, in buffers 0-500 m around nests we found only 7,8%
territories without any forest loss. Forest loss in the range of 0-20% was detected on the
majority (83,0%) of the 500 m buffers around nests.
Table 1
The scale of forest loss in buffers of different sizes around Black Stork nests
Percentage Number Distance buffers (cumulative)
of forest of nests
loss 0-100 m 0-200 m 0-300 m 0-400 m 0-500 m
n 87 47 26 12 11
No loss
% 61,7 33,3 18,4 8,5 7,8
n 34 74 98 114 117
0-20%
% 24,1 52,5 69,5 80,9 83,0
n 11 14 14 12 11
20-40%
% 7,8 9,9 9,9 8,5 7,8
n 7 5 2 3 2
40-60%
% 5,0 3,5 1,4 2,1 1,4
n 1 1 1 - -
60-80%
% 0,7 0,7 0,7 - -
n 1 - - - -
80-100%
% 0,7 - - - -