
Page 27 - NZDPM 33/2017
P. 27
26 Bokotey A., Strus Iu., Dzubenko N.
buffers with 500 m radius around those points to compare additionally the forests structure
in 500 m buffers around the nests with random locations.
To analyze frequencies statistically, we used Pearson's chi-squared test in MS Excel
2016. The GIS analysis was performed in ArcGIS for Desktop 10.5.
Apart from habitat analysis, we have also studied locations of individual nests on trees.
A total of 375 nests of Black Stork from six regions in Ukraine (Volyn, Rivne, Zhytomyr,
Kyiv, Chernihiv and Sumy regions) have been considered.. Tree species, nest location
height, and nest position on a tree were described.
Results and discussions
Usage of forest habitats by Black Stork in Rivne region
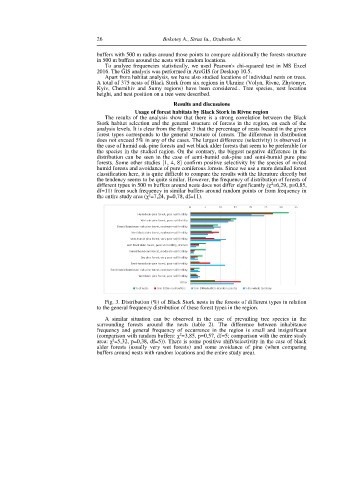
The results of the analysis show that there is a strong correlation between the Black
Stork habitat selection and the general structure of forests in the region, on each of the
analysis levels. It is clear from the figure 3 that the percentage of nests located in the given
forest types corresponds to the general structure of forests. The difference in distribution
does not exceed 5% in any of the cases. The largest difference (selectivity) is observed in
the case of humid oak-pine forests and wet black alder forests that seem to be preferable for
the species in the studied region. On the contrary, the biggest negative difference in the
distribution can be seen in the case of semi-humid oak-pine and semi-humid pure pine
forests. Some other studies [1, 4, 8] confirm positive selectivity by the species of mixed
humid forests and avoidance of pure coniferous forests. Since we use a more detailed forest
classification here, it is quite difficult to compare the results with the literature directly but
the tendency seems to be quite similar. However, the frequency of distribution of forests of
different types in 500 m buffers around nests does not differ significantly (χ =6,29, p=0,85,
2
df=11) from such frequency in similar buffers around random points or from frequency in
2
the entire study area (χ =7,24, p=0,78, df=11).
Fig. 3. Distribution (%) of Black Stork nests in the forests of different types in relation
to the general frequency distribution of these forest types in the region.
A similar situation can be observed in the case of prevailing tree species in the
surrounding forests around the nests (table 2). The difference between inhabitance
frequency and general frequency of occurrence in the region is small and insignificant
2
(comparison with random buffers: χ =3,85, p=0,57, df=5; comparison with the entire study
2
area: χ =5,32, p=0,38, df=5)). There is some positive shift/selectivity in the case of black
alder forests (usually very wet forests) and some avoidance of pine (when comparing
buffers around nests with random locations and the entire study area).